07 September 2020

Making blogger a little less painful


Table of Contents

Recently google made an update to blogger for formatting code and inserting anchors in the Compose View itself(instead of HTML view). Yeah, it was just about the time when they came out with this fine separation between "blogger" and "legacy blogger".
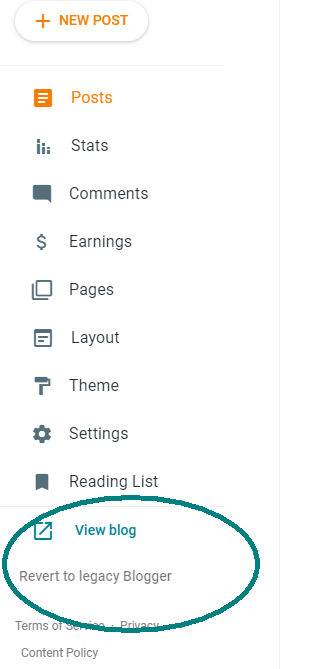
The new changes they had incorporated was very good, focused as it was on simplicity . I actually used it to create one blog post which required the use of Table of Contents right from the "Compose View". I also used it to insert my Python code right from the "Compose View". Imagine the savings in time for somebody who makes a blog post daily ?

Suddenly a few days later all of it vanished as mysteriously as they appeared. Another Google+ ??? (oh yeah, that much touted alternative to Facebook)

Google seems to have done a veto on their recent updates to blogger. But yet I prefer google over some other blogging options like Medium becos in the near future google corporation don't need to worry about monetizing blogger , unlike the corporation run by Evan William's. ( He is the same guy who started blogger too , which was latter purchased by Google ).

So I began to think - How can I make blogging more easy on blogger instead of switching to another platform. Maybe google might bring those feature back, or maybe they wont. We don't know. So lets see what we can do for now.

I would like to cover the following issues which are of concern to me:

Formatting Source Code:

I have already dealt with formatting code in one of my previous posts. Check out one of my earlier post - Syntax Highlighter for Source Code on Blogs . This deals with code-prettify and unfortunately for us this is archived and is no longer maintained. So sooner than latter, we will have to look at alternatives.

The one I found most helpful was the use of gist. I have been using GitHub for a couple of years now and so it was the logical to continue with it.

10 August 2020

Advanced Techniques in TWS API - Interactive Brokers Part 3

In the first part of the blog on the TWS API of Interactive Brokers, I have dealt with the Installation of TWS API on a Windows machine for Anaconda distro.

In the second part of the blog, titled Fundamentals of TWS API, I have dealt with the essentials to get started.

Now in this third part I seek to explore the concepts like using a scanner, retrieving the OHLCV data and writing it to a CSV file, Hedging a Futures Contract with Options and many others including a fully functional sample trading system.


Table of Contents :


Optionable Contracts in NSE using the Scanner

Let's get to the point straight - The TWS API is just an interface to the TWS. If you are having problems defining a scanner viz the API , always make sure you can create a similar scanner using the TWS or the Mosaic Market Scanner.

24 June 2020

Fundamentals of TWS API - Interactive Brokers Part 2

Generally Interactive Brokers releases the installer for both the TWS API and IB Gateway simultaneously. For this blog I will use TWS API ( Version: API 9.79 Release Date: Feb 05 2020 ) and not IB Gateway. Check out my previous blog post for detailed installation guide of TWS API on Win 10 Machine that uses the Anaconda Distribution for Python.


IB also has a host of API's. A recent one that they added is a REST based API which they refer to as Client Portal WebAPI . However this blog post deals solely with the TWS API


                            Table of Contents :

The general operation of the TWS API application is:

  1. Establish connection with IB server.
  2. Request information from IB server or execute an action
  3. If a response is provided by the IB server, then receive the response and process the response
  4. Repeat steps 2 & 3 until all the required information has been received and all the operations have been executed.
  5. Terminate the Connection with IB server.

30 April 2020

Installation of TWS API - Interactive Brokers Part 1


One advantage of Interactive Brokers (referred to as IBKR or just IB hereafter) over Kite Connect or Upstock API is that IB provide's a Paper Trading Account.

If you are an Individual, you can signup for the free trial ofInteractive Brokers . This basically gives you a "Paper Trading Account" with access to all the IBKR platforms for a couple of months including the TWS and Mosaic platforms. For the purpose of live testing our trading strategy , we have access to  Market Data ( Delayed by 10-15 minutes) and the API for retrieving data  (Not all Data) and placing orders. So yeah, the trial version of IB provides "Limited Functionality" for testing your strategies using the API. 

Some of the things that you can do with ApplicationProgramming Interface(API) from IBKR  :
  • Automate your strategies
  • Create a custom trading terminal
  • Develop a Screener
  • Experiment with your own Trading Indicator
Basically if you are reading this, you know why you have opted for IBKR.

Its is important to note that there are other third party Libraries in Python like ib_insync, IbPy and IBridgePy. But these have been developed well before the release of the Python Native API which is developed by IBKR . Only the API developed by IBKR is officially supported by IBKR.  For more information on the API, Check the YouTubelink for the official videos of TWS Python API

It is always helpful to get a feel of the web interface of IB which they refer to as Client Portal and Trader Work Station(TWS) before we get started.

15 April 2020

Calculation of Supertrend (ST)

The Supertrend is one of the most widely used Indicator among the Indian traders. And unfortunately there is very little documentation on this subject at Investopedia or the chart school of Stockcharts or even with Zerodha Varsity. So it required quite some investigation to arrive at the right method to calculate the Supertrend.

In its simplest form, when the Supertrend is overlayed over a candlestick chart, if the Supertrend crosses to below the Price we take a Long Position and when the Supertrend crosses to above the Price, we take a Short position. Here is a snapshot of the Supertrend.

This article from Economic Times is probably a good place to start with to get a qucik overview of Supertrend.

So let us dive straight into and get the calculation of Supertrend. Check this Google Sheet for the Calculation of Supertrend. 

Given below is the pseudo code for the calculation of Supertrend:

Basic UpperrBand = (High + Low) / 2 + Multiplier * ATR
Basic LowerBand =  (High + Low) / 2 - Multiplier * ATR

Final UpperBand = IF((Current BasicUpperband < Previous Final UpperBand) OR 
                    (Previous Close > Previous Final UpperBand))  THEN 
                    (Current Basic UpperBand) ELSE
                    (Previous FinalUpperBand)

Final LowerBand = IF((Current Basic LowerBand > Previous Final LowerBand) OR
                    (Previous Close < Previous Final LowerBand)) THEN
                    (Current Basic LowerBand) ELSE
                    (Previous Final LowerBand)

SuperTrend = IF((Previous SuperTrend = Previous Final UpperBand) AND 
               (Current Close <= Current Final UpperBand)) THEN 
               Current Final UpperBand
             ELSE
                IF((Previous SuperTrend = Previous Final UpperBand) AND
                  (Current Close > Current Final UpperBand)) THEN
                  Current Final LowerBand
                ELSE
                   IF((Previous SuperTrend = Previous Final LowerBand) AND
                     (Current Close >= Current Final LowerBand)) THEN
                     Current Final LowerBand
                   ELSE
                      IF((Previous SuperTrend = Previous Final LowerBand) AND
                        (Current Close < Current Final LowerBand)) THEN
                        Current Final UpperBand

Now lets see how this is calculated in Python. Lets first download the OHLCV data from the above google sheet into a CSV file. Name it as "test data". We can use this as our input file for the Python program.

Lets first take a look at the Imports and Global Declarations that we will use in this program:
#imports used in the program
import numpy as np
import pandas as pd

#Global Declarations
input_file = "test data.csv"
multiplier = 2 # An integer to indicate the value to multiply the ATR.
period = 14
atr = 'ATR' + '_' + str(period)
st = 'SuperTrend' + '_' + str(period) + '_' + str(multiplier)

03 December 2019

Calculation of Average True Range (ATR)

Average True Range (ATR) is a Technical Indicator that measures Market Volatiity. This indicator was developed by Welles Wilder

From Statistics , we know that Range in Trading refers to the (High - Low) for the timeperiod/candlestick in concern. Wilder has started a Concept caled True Range which is defined as the Greater of the following:
  • Current High minus the current Low
  • Absolute Value of Current High minus the previous Close
  • Absolute Value of Current Low minus the previous Close
For more details on ATR, check out Investopedia

Welles Wilder used the Absolute Values as he was interested in measuring the distance between two points, not the direction.

Take a look at the Google Sheet for Calculation of ATR. I have used GOOGLEFINANCE function to retreive the OHLCV of NIFTY for the first quarter of 2019. The GOOGLEFINANCE function is actually what makes Google Sheets such a compelling use. In due course I intend to publish a post to retreive OHLCV data for 1 minute candlestick from Google Sheets , on that can be used with Pandas DataFrame. In my opinion, once we create such an API, it is a better alternative to Quandl or Alpha Vantage or Quantra Blueshift or Twelve Data API for Backtesting. It also gives us the opportunity to do Live Testing of a Trading System with Live Data , but without risking actual Money. But more on that later on .... Here is the Google Sheet for now :

https://docs.google.com/spreadsheets/d/13pKpTZuDgPlb7jqH2Pyp8ypo7G97NKgV1YIgJ4j4toI/edit#gid=1308165568

The calculation in the above google sheet is based on the standards as per StockCharts

Now lets copy the Values in the Excel We can copy the OHLCV data from the above google sheet and calculate the rest of the data. If you do it n a Excel spreadsheet, you will see that the ATR obtained from the excel is the same as the ATR obtained from Google Sheet. Now let us convert the excel to csv and use this csv file as the Input for our Python program.

15 October 2019

Create a Virtual Environment With Anaconda

Background:

Sooner than latter we will have to setup a Virtual Environment in Python. And this blog post is an endeavour to provide a method to create a virtual environment using Conda Package Manager for the Anaconda installation. Pls. note that I am running Anaconda on Windows 10 64 bit.


Why Create a Virtual Environment ?

Sometimes we may be running different projects on our computer with each project using its own version of different packages. As an example, I have a project that uses quantopian Zipline which needs Python 3.5 but the present version of anaconda download is using Python 3.7. So trying to run this project in Python 3.7 will not work. Another project was developed on Python 3.6 and Selenium 3.4.3 which supports Firefox browser automation and this will require its own environment. If I try to run the code of the first project in the environment of the second project and vice-versa it will not run.
Essentially , the virtual environment keep the dependencies in a separate Sandbox where we can run them without any conflicts. To give a rough analogy, they are analogous to a Docker Container in DevOps.


Using Conda Manager:

Venv is the default from Python 3.3 onwards. And Anaconda is a python distribution, with installation and package management tools. Since I am using Anaconda, I prefer to stick to the official Anaconda Package Manager called Conda. This translates to lesser chances of any breakage in the anaconda system. Tip: If you are also using Anaconda, stick to conda wherever and whenever  possible for installation. As an example, if I wanted to install the Technical Indicator Library, Ta-Lib , I can either do a pip install or I can search the anaconda cloud for Ta-Lib . It is always better to go with the latter as it can be installed with Conda.

Now lets Create the Conda Virtual Environment with:
conda create -n testenv
where testenv is the name of the new environment.

In the event that we want to setup the environment for running quantopian's zipline which requires Python 3.5, then we can type:
conda create --name testenv python=3.5 -y
The additional ‘-y’ flag essentially informs the command line to say ‘yes’ to all of the prompts that follow. While this is optional, it does save me a little it of a hassle. The -n can also be expanded and replaced with --name